
Litecoin (LTC/USD) Price Analysis:
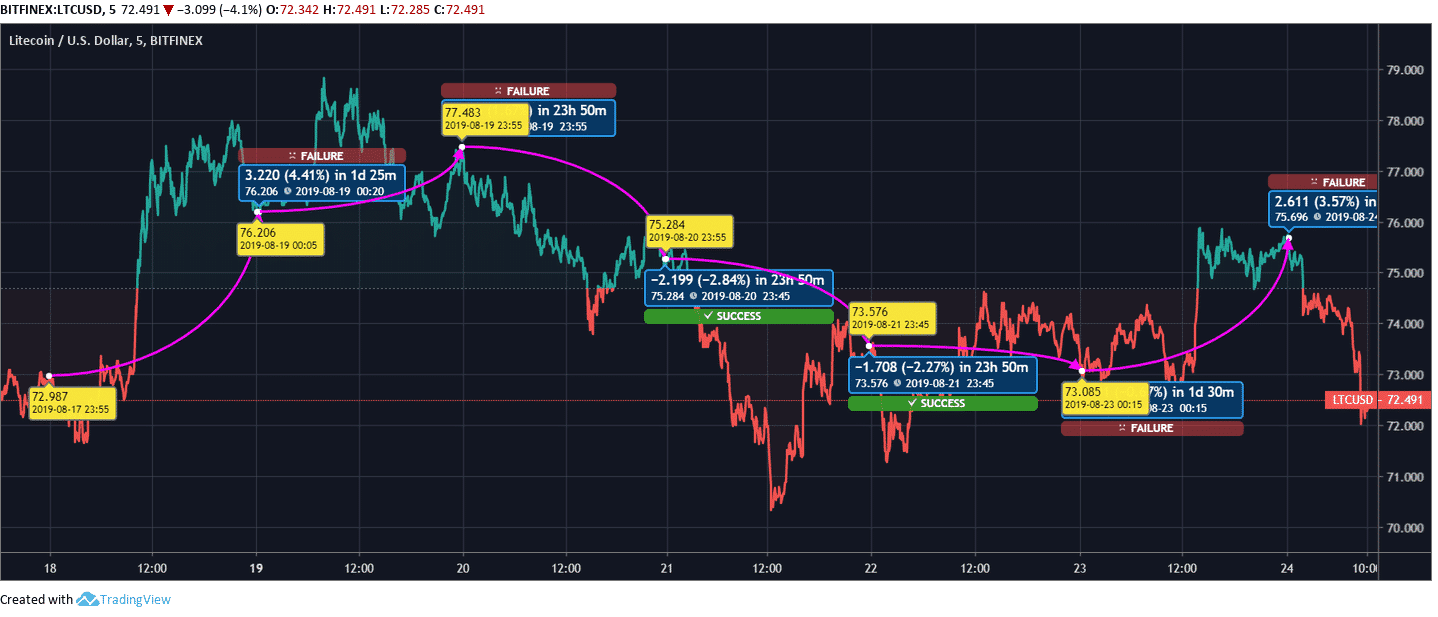
Litecoin is dealing with the bear in the intraday chart. The coin is at $72.4. The coin was seen reflecting a downtrend movement during the beginning of the month. There was a sign of improvement in the middle, but the coin fell again. The recent trend reflects an improvement in the coin. Let’s have a look at the weekly chart.
The given chart is reflecting an improvement in the price of the coin. On 18th August, the coin jumped from $72.9 to $76.2 by 4.41%. On 19th August, the coin continued the hike. The price jumped from $76 to $77 by 2.42%. From 20th August, the coin started falling from $77 to $75 by 2.84%.
On 21st August, the price slipped from $75 to $73 by 2.27%. On 22nd August, the coin kept moving down from $73.5 to $73.08 by 1.27%. On 23rd August, the coin jumped from $73 to $75 by 3.57%. Today, the price is experiencing a heavy pull-back, hence the coin is falling.
The coin would be best suited for long term traders. The same would bring colossal profit.
Binance Coin (BNB) Price Analysis:
Binance Coin (BNB) seems to get bitten by the bear. The coin was seen riding the bulls a few days ago. The current scenario is quite disturbing, but we are hopeful that the coin would soon come of the downtrend.
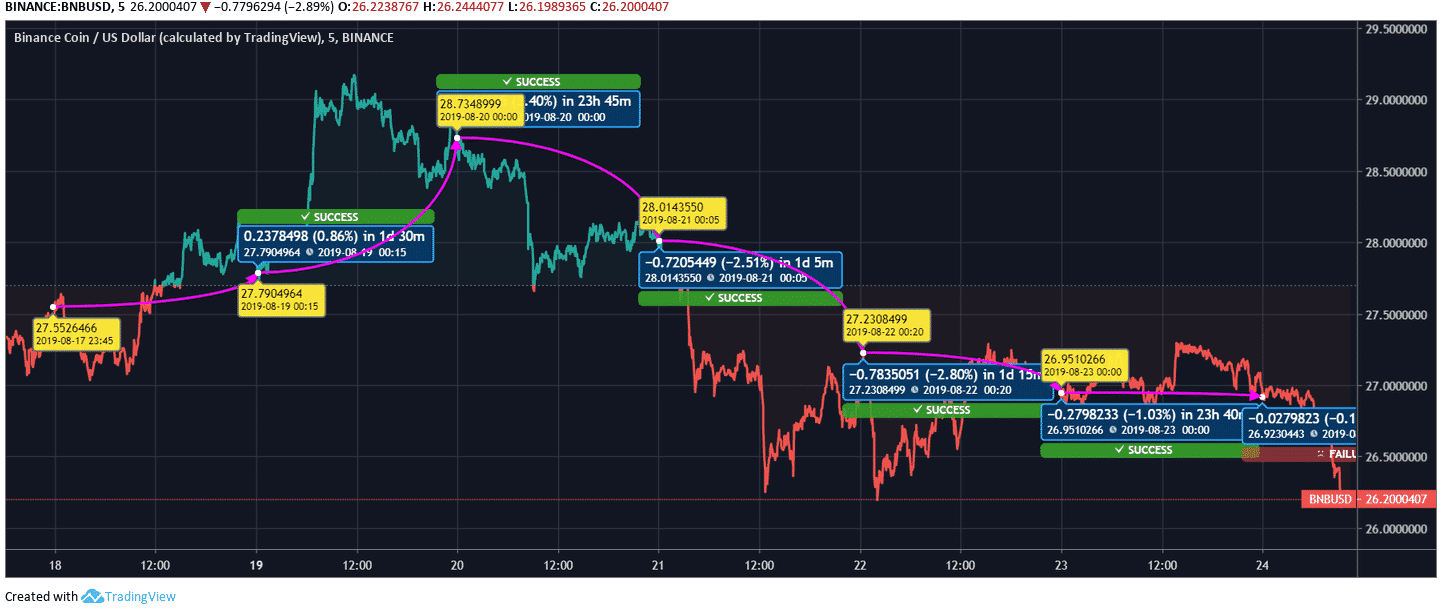
The price chart of Binance Coin (BNB) is reflecting a heavy drop. On 18th August, the coin switched from $27.5 to $27.7 by 0.86%. On 19th August, the price jumped from $27.7 to $28.7 by 2.40%. On 20th August, the coin experienced a fall of 2.51% from $28.7 to $28 by 2.51%.
On 21st August, the coin slipped from $28 to $27 by 2.80%. On 22nd August, the coin slipped from $27.2 to $26.9 by 1.03%. Yesterday, the coin moved slightly down from $26.9 to $26.9 by 0.16%. Today, the coin opened at $26.9 and is dropping down.
The coin is assumed to climb in the future. Investing in the coin wouldn’t go futile, but the investment in the crypto market is always recommended to divide into several coins for tuning down the risk.
Stellar (XLM/USD) Price Analysis:
Stellar has finally caught the bull. The coin couldn’t give a satisfactory result in the ongoing market trend. The coin was seen tremendously dropping on the price chart. Let’s have a look at the weekly chart.
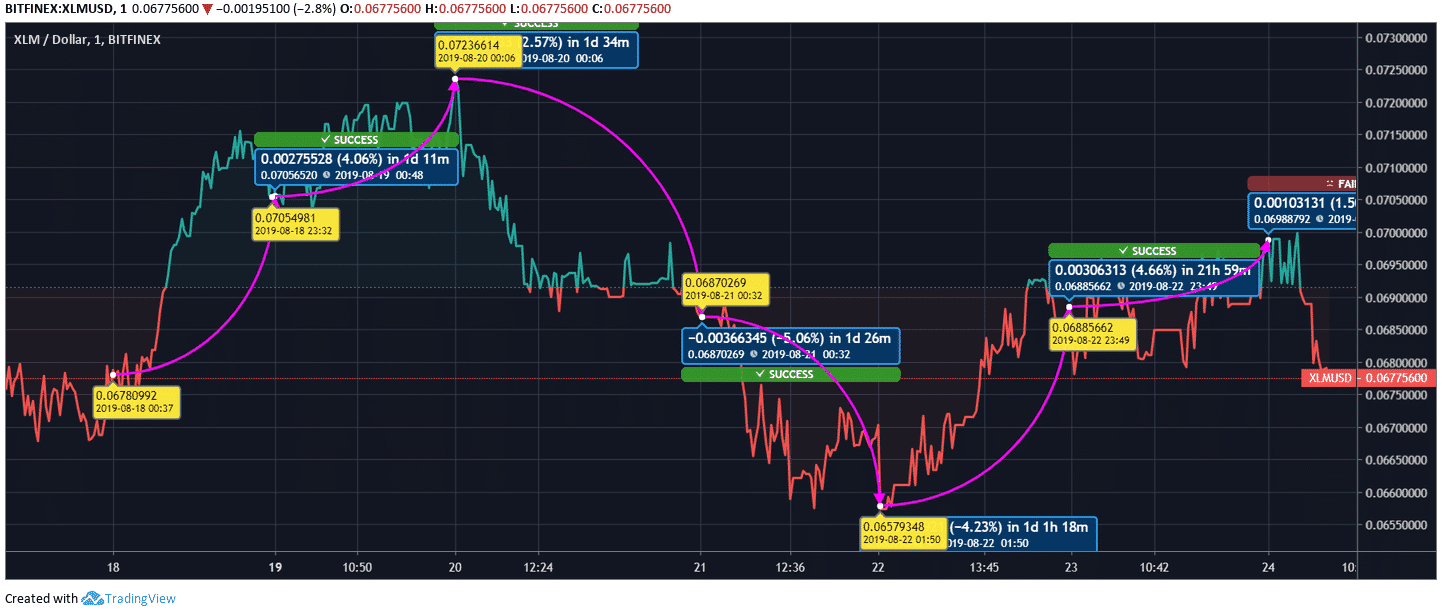
Looking at the chart, the coin is reflecting an upsurge. The coin started moving up from 18th August. The coin moved from $0.067 to $0.070 by 4.06%. On 19th August, the coin touched $0.072 from $0.070 by 2.57%. On 20th August, the coin slipped from $0.072 to $0.068 by 5.06%.
On 21st August, the coin changed from $0.068 to $0.065 by 4.23%. On 22nd August, the coin again started moving up from $0.065 to $0.068 by 4.66%. On 23rd August, the coin kept moving up. The price changed from $0.068 to $0.069 by 1.5%. Today, the coin started at $0.069 and is now dealing at $0.067.
The coin is speculated to touch new highs in the future. The traders should go for long term investment with the prospect of drawing huge dividends.