Ethereum (ETH/USD) Price Analysis:
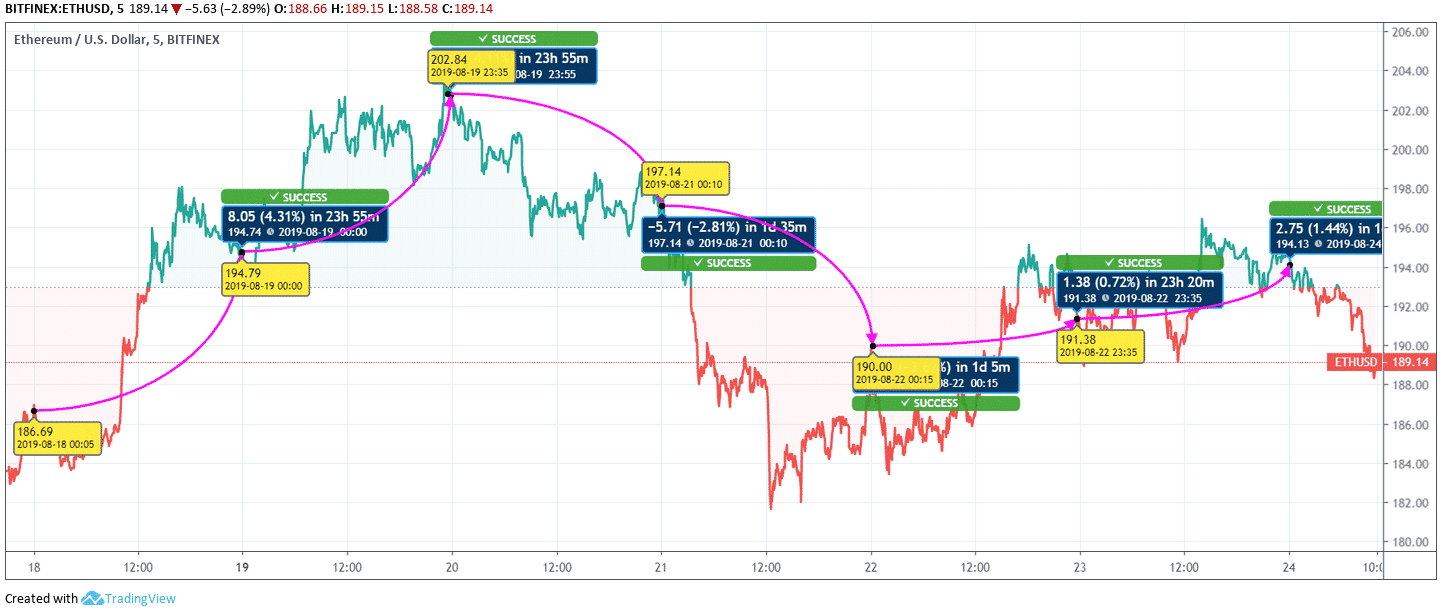
Ethereum is the second-largest coin in the market. The coin is currently dealing at $189.14. The market cap stands at $20,280,179,819 (11:02 UTC). The week-long chart is reflecting a slight upsurge in the price. Starting from 18th August, the coin opened with an escalation of 4.31%. The price changed from $186.6 to $194.7. The escalation continued from $194 to $202 by 3.06% on 19th August.
From 20th August, the price of the coin started falling. The day witnessed a drop of 2.81% of regression as the price changed from $202 to $197. On 21st August, the fall continued on the chart. The price switched from $197 to $190 by 2.30%. On 22nd August, the price of the coin embarked the escalation once again. The price changed from $190 to $191 by 0.72%. Yesterday, the coin marked a hike of 1.44% from $191 to $194. Today, the coin is experiencing a fall.
The coin is counted among the most promising investment. The traders rely on Ethereum to earn high dividend in the future. The coin is anticipated to touch $250 in the coming years. We are positive that the investment in the coin wouldn’t go futile.
Ripple (XRP/USD) Price Analysis:
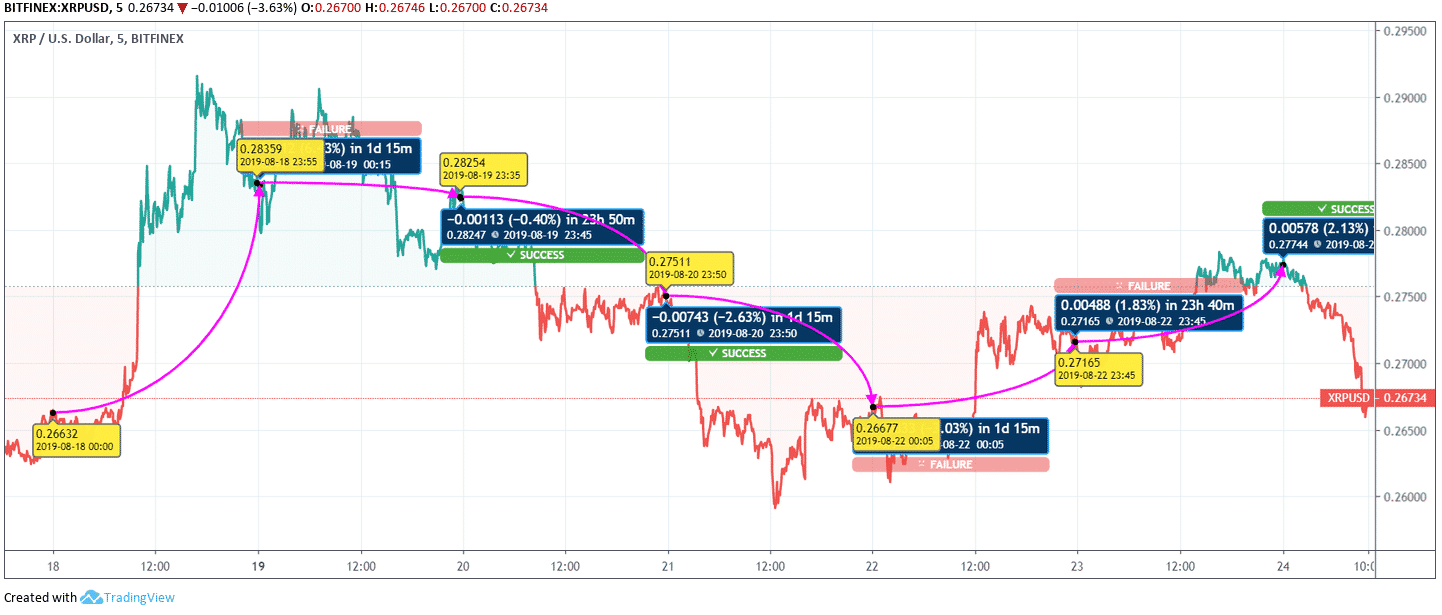
Ripple is the third-largest coin in the market. The coin is dealing at $0.26. The market cap was noted as $11,532,256,466 at 11:07 UTC. Let’s have a look at the weekly chart. Looking at the price chart, we can observe an escalation. On 18th August, the coin took a terrific jump from $0.266 to $0.293 by 3.13%. The drop started on 19th August. The coin slipped from $0.283 to $0.282 by 0.40%.
On 20th August, the coin dropped from $0.28 to $0.27 by 2.63%. On 21st August, the dropped continues, and the coin fell from $0.27 to $0.26 by 2.03%. On 22nd August, the coin experienced an escalation of 1.83%. The price changed from $0.26 to $0.27. Yesterday, the coin jumped from $0.271 to $0.277 by 2.13%. Today, the coin is under selling pressure hence experiencing a drop.
The coin has a high prospect of improvement in the future. The traders are recommended to go for a long term investment. The specified investment would give a colossal profit to the traders.
Bitcoin Cash (BCH/USD) Price Analysis:
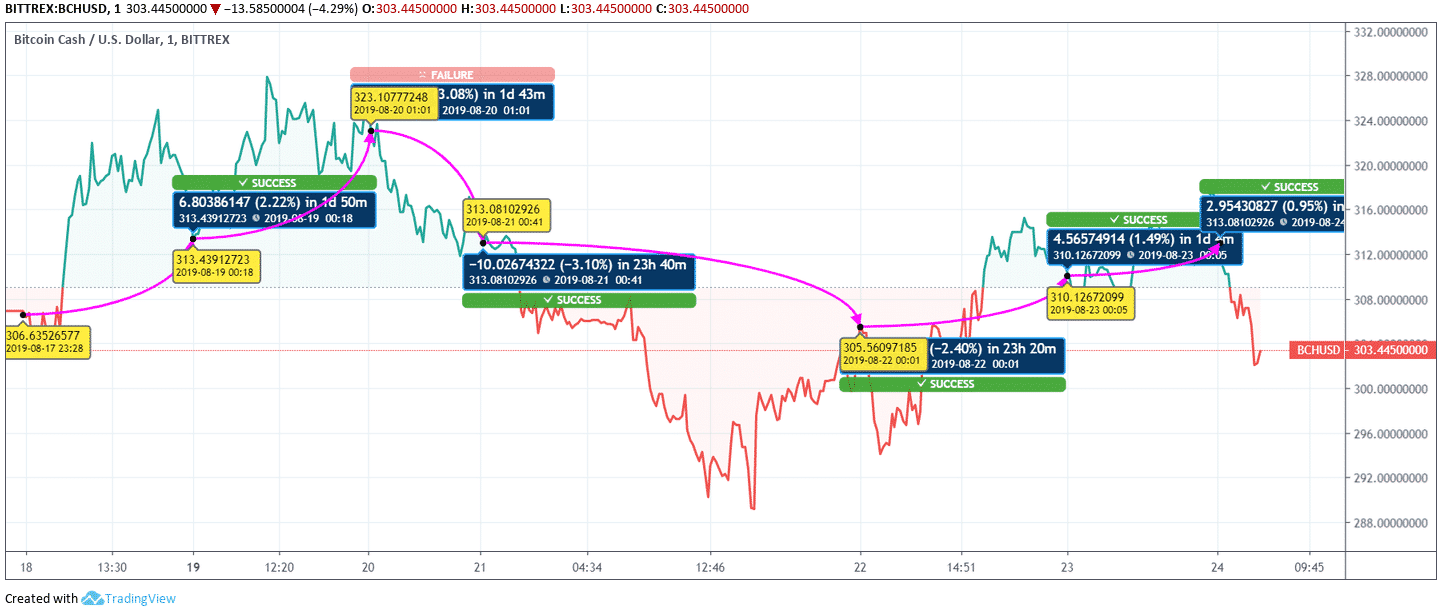
Bitcoin Cash is the fourth-largest coin in the market. The coin is dealing at $303. The market cap is marked as $5,462,847,570 at 11:11 UTC. Let’s have a look at the weekly chart. The chart is reflecting a moderate movement in the price. If we compare the price from the beginning of the week with now, then we can observe that the coin is currently dealing with the profit.
Starting from 18th August, the coin jumped from $306 to $313 by 2.22%. In 19th August, the coin continued the escalation in the price. The coin changed from $313 to $323 by 3.08%. On 20th August, the coin slipped from $323 to $313 by 3.10%. On 21st August, the coin kept falling from $313 to $305 by 2.40%.
On 22nd August, the coin started improving. The coin shifted from $305 to $310 by 1.49%. On 23rd August, the coin jumped from $310 to $313 by 0.95%. Today, the coin is under great pressure. The coin walks as per Bitcoin. The future holds a high prospect of improvement. We would recommend the traders to dig in for long term and book profits.